Trendwatching is something that many companies do, and it is also something that many people focusing on the future need to do. Market trends and analytics serve as a powerful tool in the world for both businesses and individuals. It is therefore no secret that people want to get better at it and businesses want to use it for their own. As a trendwatcher, you also want to know the best ways possible to forecast trends and give insights.
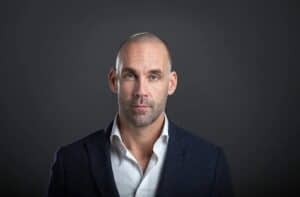
One well-known example is Richard van Hooijdonk, a futurist and international keynote speaker who uses trendwatching extensively to advise governments, Fortune 500 companies, and educational institutions. In his talks and publications, he explains how upcoming technologies such as AI, robotics, and blockchain are shaping the future. His use of data, scenario planning, and future thinking serves as a practical guide for anyone in the trendwatching field.
In this blog post, we will discuss how forecasting reports and databases work and how to read them, and which social media monitoring tools to use. We will dive deeper into data analysis and visualisation tools to use, and online communities and forums, which will give insights into market trends.
Trend forecasting reports and databases
To effectively read trend forecasting reports and databases, you need to focus on understanding the data collection methods, analysis techniques and the context in which the trends are presented. In a forecasting report or database, there will always be an objective. Start by identifying the objective of the report, and then start examining the key metrics and indicators used.
Richard van Hooijdonk often refers to such databases when he explores topics like the future of work or smart cities. He combines insights from McKinsey, the World Economic Forum, and proprietary research to build compelling future scenarios. For example, in his trend reports, he breaks down data into actionable foresight for businesses to anticipate changes.
You should follow these key steps to read trend forecasting reports and databases:
- Define the objective, and understand the purpose of the report or database, and which specific trends are being analysed?
- Identify the key metrics and indicators, which datapoints are being tracked, and how they are measured.
- Understand the data collection methods, how was the data gathered?
- Analyse data visualisation, how is the data presented? In a graph, chart or other visual tools.
- Interpret the results, look for patterns, fluctuations and correlations between data, consider the potential impact of these trends on your specific field or see a repeat of an event.
- Evaluate the methodology, assess the analysis technique used and determine if they are appropriate for the type of data and trends that you are investigating.
Social media monitoring tools
Social media monitoring tools help track, analyse and respond to conversations about brands, topics and individuals across various social platforms. These tools are essential for trend watchers in order to understand public perception, identify trends and manage online reputation. Popular tools include Sprinklr, Hootsuite, Sprout Social and Meltwater. Each of these social media monitoring tools has unique features and trend analysis.
Van Hooijdonk illustrates the power of these tools by showing how real-time social media sentiment around technological change influences public acceptance. For example, when examining reactions to autonomous vehicles or biometric surveillance, he uses insights from social media trends to support his forecasts.
Key features of social media monitoring tools:
- Real-time monitoring: This feature is important since it tracks mentions, keywords, and hashtags as they happen.
- Sentiment analysis: This tracks the emotional tone of the conversations.
- Trend detection: This identifies emerging topics and shifts in audience interests.
- Competitor analysis: which is always interesting to see what the competitor is doing and their brand perception.
- Influencer identification: Identify individuals with significant reach and influence.
- Data visualisation: present data in charts and graphs for easy understanding of information.
Moreover, you can also analyse the alerts and notifications that will happen in real-time and see the spikes in engagement. Furthermore, the cross-platform integration is something you can measure with social media monitoring tools, which will monitor multiple social media platforms simultaneously and can even be integrated with CRM and marketing automation tools.
Data analysis and visualisation tools
In our last part, we talked a bit about data visualisation. We will dive deeper into this together with data analysis.
Analysing data and visualising it to make it more accessible involves examining both historical and current data to identify patterns, which in turn allows for the prediction of future outcomes. It is a systematic process that is used across various fields and is also applicable to the public speaking branch.
Richard van Hooijdonk’s methodology often includes advanced data visualisation to explain complex future developments in an accessible way. For example, when forecasting the impact of quantum computing or climate tech, he uses compelling visuals to simplify disruptive technologies for wider audiences.
Analysing data by understanding the patterns and being able to recognise the different trends is important. Trend analysis aims to uncover recurring patterns, both positive and negative. Trends can be short-term or long-term, or even seasonal. Trend analysis can utilise various data sources, like customer behaviour patterns.
There are different techniques for trend analysis that you must know as a trend watcher:
- Moving averages: This method will smooth out fluctuations in data to reveal the underlying trends.
- Exponential smoothing: This method weights different data points more heavily to capture the recent changes.
- ARIMA Model: This model uses statistics which is used for forecasting time series data.
Data analytics is well-known in all kinds of fields and can help make informed and strategic decisions based on data-driven insights. Data is nowadays the new currency and can be traded through various industries. Knowing the value of certain data and knowing how to read the data is of a lot of value and is a must for a professional trendwatcher. As Richard van Hooijdonk often says, “Data is the new gold” — and those who can analyse and visualise it well will lead future innovations.
Online communities and forums
Online communities and forums are evolving with trends like AI-driven personalisation, niche and micro-communities, which focus on authenticity and human interaction. Most platforms are increasingly utilising AI for tasks like content creation and sentiment analysis while also focusing on engagement. There is a growing emphasis on data privacy and community empowerment.
Communities are doubling down on authenticity and human connection to keep members engaged, which includes prioritising genuine interactions, fostering a sense of belonging and creating supportive environments. Richard van Hooijdonk frequently engages with online communities related to futurism and innovation. He uses platforms like LinkedIn, Reddit (e.g., r/Futurology), and private innovation forums to test ideas, gauge audience sentiment, and crowdsource insights.
By using these tools to your advantage and keeping the above-mentioned points in mind, you can shape the way you think and interact during public speeches and events. You will get new and valuable insights into the way your audience or niche market thinks. Be ahead of the curve and add value to your events by knowing how to look for trends by analysing the past and present.
Share via:


